- Published
- Reading
- 5 min
- Figures
- 11 figures, 5 interactive
- Topics
- MLATE, machine learning, tissue engineering
· 5 min read · 11 figures, 5 interactive
The idea behind MLATE
Why I started turning the scaffold literature into data for machine learning, how the question changed over three versions, and what a tool like this can and cannot do.
In brief
- Published scaffold experiments can become training data; MLATE V3 turns 220 studies into 2,646 rows.
- The literature over-reports success, so a model trained on it sees a more optimistic world than the lab does.
- The question moved from which algorithm predicts best to which few formulations to make first.
- A high score means “worth testing”, not “will work”.
Contents · 6 sections, 11 figures
Every scaffold starts with a guess. Before anything is printed, someone has to choose a biomaterial or a blend, its concentration, the cells and how many of them, and the printing conditions. Each choice affects the others, and the usual way to find out whether a combination works is to make it and test it. That is slow and expensive, and most of what is learned along the way stays in one lab.
Fig. 1Illustration: invented numbersInteractive
How fast the choices multiply
Change the options per choice and the experiments per month.
720 formulations,about 7.5 years at 8 a month
That is about 1.9 four-year PhDs of nothing but experiments.
- One year of experiments: 96 formulations
- Still untested after a year: 624
- 1 square = 1 formulation
| Example | Formulations | Time at 8 a month |
|---|---|---|
| Small study3 × 2 × 1 × 2 × 2 | 24 | about 3 months |
| Medium study10 × 3 × 2 × 3 × 4 | 720 | about 7.5 years |
| Broad screen20 × 5 × 3 × 4 × 6 | 7,200 | about 75 years |
Options per choice, in order: biomaterial blends × concentrations per material × cell types × cell densities × printing settings.
Invented numbers. A few modest choices already add up to years of testing. Real projects rule out many combinations early, but the product still grows faster than any lab can test.
MLATE (Machine Learning Applications in Tissue Engineering) started from a simple observation during my MSc: as a field, we have already run a very large number of these experiments. They are scattered across papers, described in different words and units, but they exist. If they could be turned into data, a model could learn from all of them at once and give a researcher a better first guess.
Fig. 2Data
MLATE V3 in five numbers
- 2,646samples
- 220studies
- 130biomaterials
- 186cell lines
- 18tissue-engineering contexts
A dataset assembled by hand from 220 papers. Each row is one scaffold formulation: what went into it, how it was printed and how it turned out, as its authors reported.
Source: Rafieyan et al. (2026), MLATE V3, Biofabrication. Samples, studies and contexts counted from the public dataset (commit 68a302c).
This post is about that idea and how it changed over three versions. The papers describe the methods and the numbers; here I want to explain the thinking behind them. The research is shared with my co-authors, who are listed on each paper, and the views here are my own.
The literature as a dataset
The first lesson was that building the dataset is most of the work. A paper describes a scaffold in prose, tables and figure legends, rarely in the same way as the next one. Concentrations come in different units, the same cell line appears under different names, and variables such as printing temperature or crosslinking time are often not reported at all. Turning that into consistent rows means reading closely, deciding carefully what counts as the same thing, and accepting that some values have to be estimated.
Fig. 3Illustration: invented numbersInteractive
From a methods sentence to a dataset row
Step through to see how each phrase becomes a value.
Methods sentence (invented)
BMSCs (2 × 10⁶ cells/mL) were mixed into 3% (w/v) alginate and 5% GelMA, printed through a 22G needle at 0.8 bar and 10 mm/s, and crosslinked in 100 mM CaCl₂.
Not stated: crosslinking time, syringe and substrate temperature.
Dataset row 11 of 148 MLATE V3 columns
- 1Alginate (%w/v)
- 3as written
- 2GelMA (%w/v)
- 5unit assumed
- 3CaCl2 (mM)
- 100as written
- 4Cell Line
- bMSCsname matched
- 5Cell Density (million cells/mL)
- 2rescaled
- 7Physical Crosslinking Duration (s)
- blanknot reported
- 6Extrusion Pressure (kPa)
- 80converted
- 6Nozzle Movement Speed (mm/s)
- 10as written
- 6Nozzle Diameter (µm)
- 410estimated
- 7Syringe Temperature (°C)
- blanknot reported
- 7Substrate Temperature (°C)
- blanknot reported
Not shown: reference, DOI and tissue columns; the other 127 material columns (0, not in this blend); Photo Crosslinking Duration (s), also blank here; two duplicate-audit columns; and Printability and Cell Response, which are scored from the results, not from the methods.
Where each phrase goes
| Phrase | Column | Stored value |
|---|---|---|
| 1 3% (w/v) alginate | Alginate (%w/v) | 3 |
| 2 5% GelMA | GelMA (%w/v) | 5unit assumed |
| 3 100 mM CaCl₂ | CaCl2 (mM) | 100 |
| 4 BMSCs | Cell Line | bMSCs |
| 5 2 × 10⁶ cells/mL | Cell Density (million cells/mL) | 2 |
| 6 0.8 bar | Extrusion Pressure (kPa) | 80 |
| 6 10 mm/s | Nozzle Movement Speed (mm/s) | 10 |
| 6 22G needle | Nozzle Diameter (µm) | 410estimated |
| 7 not stated | Physical Crosslinking Duration (s), Syringe Temperature (°C), Substrate Temperature (°C) | blanknot reported |
Step 1 of 7
A value already in the right unit
‘3% (w/v) alginate’ matches the column Alginate (%w/v), so 3 is stored as written. Every material the sentence does not mention gets 0 in its column: it is not in the blend.
A unit read from context
‘5% GelMA’ has no unit. Alginate in the same sentence is in % w/v, and GelMA is usually reported that way, so 5 goes into GelMA (%w/v). It is a reasonable reading, but still an assumption.
The crosslinker is a column too
‘100 mM CaCl₂’ fills CaCl2 (mM), one of the 130 material columns, so the ionic crosslinker counts as part of the formulation. A paper that gave the bath as 1.1% (w/v) would need converting to mM first, using the molar mass of the salt.
Matching the cell name
‘BMSCs’ differs from the dataset label bMSCs only in case, so it is merged into it. Similar names are not merged blindly: MSCs and hMSCs stay separate labels in V3, because a paper that does not say where its cells came from may not mean the same cells.
A change of scale
‘2 × 10⁶ cells/mL’ becomes 2 in Cell Density (million cells/mL). The same density could be written as 2 M/mL, 2,000 cells/µL or 2 × 10⁵ cells in 100 µL; each has to end up as 2.
Three printing settings, three decisions
0.8 bar is 80 kPa, and 10 mm/s needs no change. A 22G needle is stored by its inner diameter, about 0.41 mm, so 410 µm. Gauge charts give 0.41 or 0.413 mm, so even this step is a small estimate.
What is not reported stays blank
The sentence gives no crosslinking time and no syringe or substrate temperature, so those cells stay blank instead of being guessed. Blank is not 0: 0 means a material is absent, blank means the value was never reported. V3 leaves blanks in the published file and fills them only inside each cross-validation fold, when models are trained. See how often each variable goes unreported.
- A value already in the right unit
‘3% (w/v) alginate’ matches the column Alginate (%w/v), so 3 is stored as written. Every material the sentence does not mention gets 0 in its column: it is not in the blend.
- A unit read from context
‘5% GelMA’ has no unit. Alginate in the same sentence is in % w/v, and GelMA is usually reported that way, so 5 goes into GelMA (%w/v). It is a reasonable reading, but still an assumption.
- The crosslinker is a column too
‘100 mM CaCl₂’ fills CaCl2 (mM), one of the 130 material columns, so the ionic crosslinker counts as part of the formulation. A paper that gave the bath as 1.1% (w/v) would need converting to mM first, using the molar mass of the salt.
- Matching the cell name
‘BMSCs’ differs from the dataset label bMSCs only in case, so it is merged into it. Similar names are not merged blindly: MSCs and hMSCs stay separate labels in V3, because a paper that does not say where its cells came from may not mean the same cells.
- A change of scale
‘2 × 10⁶ cells/mL’ becomes 2 in Cell Density (million cells/mL). The same density could be written as 2 M/mL, 2,000 cells/µL or 2 × 10⁵ cells in 100 µL; each has to end up as 2.
- Three printing settings, three decisions
0.8 bar is 80 kPa, and 10 mm/s needs no change. A 22G needle is stored by its inner diameter, about 0.41 mm, so 410 µm. Gauge charts give 0.41 or 0.413 mm, so even this step is a small estimate.
- What is not reported stays blank
The sentence gives no crosslinking time and no syringe or substrate temperature, so those cells stay blank instead of being guessed. Blank is not 0: 0 means a material is absent, blank means the value was never reported. V3 leaves blanks in the published file and fills them only inside each cross-validation fold, when models are trained. See how often each variable goes unreported.
Invented example. The sentence is made up; the column names are the real ones from the MLATE V3 dataset. Unit conversion, name matching and blanks are where most curation time goes.
The second lesson was about what the literature leaves out. Papers report what worked far more often than what failed, so a model trained on published scaffolds sees a world that is more successful than the real one. I think this is one of the most important limits of any tool built from the literature, and it shapes how I describe what MLATE does.
Fig. 4Data
The published record is mostly successes
Printability class
- 0Not extruded
- 1Liquid or beading
- 2Extrudable
- 3Extrudable, optimised
All samples n = 2,646
Not extruded 8.2%, Liquid or beading 15.0%, Extrudable 26.9%, Extrudable, optimised 49.9%.
With cells n = 1,073
Not extruded 1.9%, Liquid or beading 4.3%, Extrudable 11.8%, Extrudable, optimised 82.0%.
Without cells n = 1,573
Not extruded 12.5%, Liquid or beading 22.3%, Extrudable 37.2%, Extrudable, optimised 28.0%.
Half of all samples, and 82% of those with cells, carry the top printability class. This is what the published record contains. Studies with cells may also start from inks optimised in earlier work.
Source: MLATE V3 public dataset (2,646 samples), counted by scripts/blog-data/mlate-v3.mjs
Show the numbers
| Class | All samples n = 2,646 | With cells n = 1,073 | Without cells n = 1,573 |
|---|---|---|---|
| 0 · Not extruded | 216 (8.2%) | 20 (1.9%) | 196 (12.5%) |
| 1 · Liquid or beading | 397 (15.0%) | 46 (4.3%) | 351 (22.3%) |
| 2 · Extrudable | 712 (26.9%) | 127 (11.8%) | 585 (37.2%) |
| 3 · Extrudable, optimised | 1,321 (49.9%) | 880 (82.0%) | 441 (28.0%) |
| Total | 2,646 (100%) | 1,073 (100%) | 1,573 (100%) |
Nobody knows the true failure rate, because failures rarely reach a journal. But even simple arithmetic shows how far a modest publication filter can move the picture.
Fig. 5Illustration: invented numbersInteractive
How selective reporting inflates success
Move the sliders to see how the published picture changes.
- Success (filled square)
- Failure (outlined square)
All experiments run
30%succeed in the lab
What gets published (scaled to 100)
77%succeed in the journals
Per 100 experiments run: 30 successes × 80% = 24 published; 70 failures × 10% = 7 published. Successes are 24 of the 31 published results (77%).
| Succeed in the lab | 10% | 30% | 60% |
|---|---|---|---|
| Successes published | 8 | 24 | 48 |
| Failures published | 9 | 7 | 4 |
| Succeed in the journals | 47% | 77% | 92% |
Invented numbers. The publication chances are assumptions for illustration; nobody has measured them for scaffold studies. In animal studies of stroke, leaving unpublished experiments out made treatments look nearly a third more effective (Sena et al., 2010).
From “which algorithm?” to “which decision?”
The first version asked a narrow question: given the materials, cells and fabrication method of a cardiac tissue-engineering scaffold, can a model predict how cells will behave on it? Much of that work was comparing algorithms to see which one predicted best.1
Over time I became less interested in the leaderboard and more interested in the decision a researcher actually faces. Nobody in a lab needs a model for its own sake. They need help choosing which few formulations, out of many possible ones, are worth making first. That shift made three principles central to the project.
Fig. 6Data
Three versions, one sharper question
| V1 · 2023Computers in Biology and Medicine | V2 · 2024Biofabrication | V3 · 2026Biofabrication, online ahead of print | |
|---|---|---|---|
| Question | How will cells respond to this cardiac scaffold? | Will it print, will cells respond, and how good is it overall? | Which few formulations should be made first? |
| Scope | Cardiac tissue-engineering scaffolds from several fabrication methods. Inputs: materials, cell type, scaffold type. One output: cell behaviour, scored 0–3. 28 algorithms compared. | 3D-printed and bioprinted scaffolds: 1,171 scaffolds, 60 biomaterials, 49 cell lines. Over 40 algorithms compared. | 3D-printed and bioprinted scaffolds in 18 tissue-engineering contexts: 2,646 samples, 130 biomaterials, 186 cell lines. |
| Released openly | Trained models | Dataset and notebooks | Dataset, code and web app |
| What each version does | |||
| Uses only pre-fabrication variables | Yes | Yes | Yes |
| Predicts cell response | Yes | Yes | Yes |
| Predicts printability | No | Yes | Yes |
| Combined quality score | No | YesP × C | YesWSSQ |
| User-set ranking weights | No | No | Yes |
| Searches a design space | No | No | Yes |
| Drafts a fabrication protocol | No | No | Yes |
| Runs as a web app | No | No | Yes |
V1 · 2023Computers in Biology and Medicine
- Question
- How will cells respond to this cardiac scaffold?
- Scope
- Cardiac tissue-engineering scaffolds from several fabrication methods. Inputs: materials, cell type, scaffold type. One output: cell behaviour, scored 0–3. 28 algorithms compared.
- Released openly
- Trained models
- Yes: Uses only pre-fabrication variables
- Yes: Predicts cell response
- No: Predicts printability
- No: Combined quality score
- No: User-set ranking weights
- No: Searches a design space
- No: Drafts a fabrication protocol
- No: Runs as a web app
V2 · 2024Biofabrication
- Question
- Will it print, will cells respond, and how good is it overall?
- Scope
- 3D-printed and bioprinted scaffolds: 1,171 scaffolds, 60 biomaterials, 49 cell lines. Over 40 algorithms compared.
- Released openly
- Dataset and notebooks
- Yes: Uses only pre-fabrication variables
- Yes: Predicts cell response
- Yes: Predicts printability
- Yes: Combined quality score(P × C)
- No: User-set ranking weights
- No: Searches a design space
- No: Drafts a fabrication protocol
- No: Runs as a web app
V3 · 2026Biofabrication, online ahead of print
- Question
- Which few formulations should be made first?
- Scope
- 3D-printed and bioprinted scaffolds in 18 tissue-engineering contexts: 2,646 samples, 130 biomaterials, 186 cell lines.
- Released openly
- Dataset, code and web app
- Yes: Uses only pre-fabrication variables
- Yes: Predicts cell response
- Yes: Predicts printability
- Yes: Combined quality score(WSSQ)
- Yes: User-set ranking weights
- Yes: Searches a design space
- Yes: Drafts a fabrication protocol
- Yes: Runs as a web app
Yes NoP × C: printability × cell response, the V2 scaffold-quality scoreWSSQ: Weighted Synergistic Scaffold Quality, with weights the user sets
Each version kept the capabilities of the one before and moved one step closer to the decision in the lab. V2 narrowed the scope to printed scaffolds; V2 counts scaffolds and V3 counts samples, as each paper reports them.
Source: V1: Rafieyan et al. (2023), Computers in Biology and Medicine 158, 106804; V2: Rafieyan et al. (2024), Biofabrication 16, 045014; V3: Rafieyan et al. (2026), Biofabrication, online ahead of print; the MLATE project page.
First, the models use only what is known before fabrication, as they have since the first version. A prediction that needs measurements from the finished scaffold arrives too late to help.
Second, one outcome is not enough. A formulation that cells respond well to is of little use if it cannot be printed, and a perfectly printable ink that cells ignore is no better. The second version predicted printability, cell response and a combined scaffold-quality score for 3D-printed and bioprinted scaffolds; the third turns that combination into a ranking score whose weights the user sets, because the right balance depends on the application.
Fig. 7Illustration: invented numbersInteractive
One score for two outcomes
Move the weight and switch between WSSQ and a plain average.
Score
- 0–20
- 20–40
- 40–60
- 60–80
- 80–100
Ranking by WSSQ
- H: 79.6, plain average 79.7;
- C: 77.1, plain average 80.8;
- B: 74.6, plain average 74.8;
- E: 63.3, plain average 77.3;
- D: 55.0, plain average 56.0;
- F: 49.5, plain average 55.0;
- G: 33.3, plain average 34.0;
- A: 23.2, plain average 39.5;
WSSQ at the default weight, 30% on printability
Score
- 0–20
- 20–40
- 40–60
- 60–80
- 80–100
Every candidate’s score at 20%, 50% and 80% weight on printability. P is printability (0–3), C is cell response (1–5).
| Candidate | P | C | WSSQ | Plain average | ||||
|---|---|---|---|---|---|---|---|---|
| 20% | 50% | 80% | 20% | 50% | 80% | |||
| A | 2.9 | 1.6 | 19.9 | 32.0 | 56.4 | 31.3 | 55.8 | 80.3 |
| B | 2.4 | 3.9 | 73.9 | 76.1 | 78.4 | 74.0 | 76.3 | 78.5 |
| C | 1.6 | 4.7 | 81.8 | 68.9 | 58.9 | 84.7 | 72.9 | 61.2 |
| D | 2.1 | 3.0 | 53.3 | 58.7 | 65.1 | 54.0 | 60.0 | 66.0 |
| E | 0.9 | 4.9 | 72.1 | 50.0 | 36.4 | 84.0 | 63.8 | 43.5 |
| F | 2.7 | 2.6 | 46.0 | 57.7 | 74.3 | 50.0 | 65.0 | 80.0 |
| G | 1.3 | 2.2 | 32.1 | 35.8 | 40.0 | 32.7 | 36.7 | 40.7 |
| H | 2.2 | 4.3 | 80.5 | 77.7 | 75.0 | 80.7 | 77.9 | 75.2 |
| Top three | C, H, B | H, B, C | B, H, F | C, E, H | H, B, C | A, F, B | ||
Invented example. Unlike an average, MLATE’s published WSSQ score does not let one excellent outcome hide a poor one. At the default 30% weight on printability, a plain average puts E, which barely prints, in its top three in place of B; at 80%, it ranks A first although cells barely respond to it, while WSSQ ranks A sixth.
Source: scoring formula from compute_wssq in the MLATE V3 code, described in Rafieyan et al., Biofabrication (2026).
Show the numbers
Scores at 30% weight on printability. WSSQ is the mean of the harmonic and geometric means.
| Candidate | Printability (0–3) | Cell response (1–5) | Harmonic mean | Geometric mean | WSSQ | Plain average |
|---|---|---|---|---|---|---|
| A | 2.9 | 1.6 | 20.1 | 26.2 | 23.2 | 39.5 |
| B | 2.4 | 3.9 | 74.6 | 74.7 | 74.6 | 74.8 |
| C | 1.6 | 4.7 | 75.8 | 78.4 | 77.1 | 80.8 |
| D | 2.1 | 3.0 | 54.7 | 55.3 | 55.0 | 56.0 |
| E | 0.9 | 4.9 | 58.2 | 68.5 | 63.3 | 77.3 |
| F | 2.7 | 2.6 | 48.0 | 51.0 | 49.5 | 55.0 |
| G | 1.3 | 2.2 | 33.1 | 33.5 | 33.3 | 34.0 |
| H | 2.2 | 4.3 | 79.5 | 79.6 | 79.6 | 79.7 |
Third, a ranked shortlist is more useful than a single prediction. The third version searches a range of compositions and printing settings that the user defines, returns the most promising candidates and drafts a protocol for making them.
Fig. 8SchematicInteractive
From the literature to a shortlist
Step through the pipeline.
Phase Abuilt once from the literature
- 1Curate2,646 samples from 220 studies
- 2Impute in foldinside each cross-validation fold
- 3Find clustersbisecting k‑means, k = 4
- 4Benchmark models40 models per target
- 5Score with WSSQtwo predictions, one score
Fitted models and the WSSQ objective pass to phase B
Phase Brun for each question
- 6Define a design spacein the web app
- 7Bayesian optimisationOptuna TPE, scored in batches
- 8Ranked shortlistordered by predicted WSSQ
- 9Draft protocolstep by step, LLM-assisted
Step 1 of 9
Curate the dataset
2,646 samples from 220 published studies, covering 130 biomaterials, 186 cell lines and 18 tissue-engineering contexts. Each row holds only what is known before fabrication, plus two outcomes scored from the paper: printability (0–3) and cell response (1–5).
Impute inside each fold
Values a paper did not report stay blank in the published dataset. Tiered imputers fill them during training, fitted inside each cross-validation fold, so the rows held out for testing never influence how the training rows are filled.
Find structure first
Before any prediction, bisecting k-means groups the samples into four clusters of 426, 477, 808 and 935.
Benchmark 40 models per target
31 machine-learning models, 6 deep-learning architectures and 3 tabular foundation models are trained for each target, printability and cell response, on the same data partitions. On a random test split the best reach weighted F1-scores of 0.806 for printability and 0.773 for cell response; the repository also reports stricter splits that hold out whole studies.
Combine both predictions into one score
The two predictions are rescaled and merged into one score from 0 to 100, the Weighted Synergistic Scaffold Quality (WSSQ), with weights the user sets. A formulation predicted not to print scores 0, however well cells might respond. The fitted models and this score are what phase B uses.
Define a design space
For each question, a researcher opens the web app and sets the search: a cell line (or none), the biomaterials and the range each may take, cell density, printing-parameter ranges, the models to use and the WSSQ weights.
Search with Bayesian optimisation
Optuna’s tree-structured Parzen estimator (TPE) proposes formulations inside that space, scores them in batches with the WSSQ objective, and uses each result to decide where to look next.
Return a ranked shortlist
The best candidates come back ranked by predicted WSSQ, with the predicted class probabilities behind each score and a distance to the nearest published formulation, so a confident prediction can be told apart from an extrapolation.
Draft a fabrication protocol
For a chosen candidate, a language model drafts a step-by-step protocol, grounded in the three nearest published formulations and told to flag, not fill in, anything missing or implausible. It is a draft for an experimentalist to check, not a validated method.
- Curate the dataset
2,646 samples from 220 published studies, covering 130 biomaterials, 186 cell lines and 18 tissue-engineering contexts. Each row holds only what is known before fabrication, plus two outcomes scored from the paper: printability (0–3) and cell response (1–5).
- Impute inside each fold
Values a paper did not report stay blank in the published dataset. Tiered imputers fill them during training, fitted inside each cross-validation fold, so the rows held out for testing never influence how the training rows are filled.
- Find structure first
Before any prediction, bisecting k-means groups the samples into four clusters of 426, 477, 808 and 935.
- Benchmark 40 models per target
31 machine-learning models, 6 deep-learning architectures and 3 tabular foundation models are trained for each target, printability and cell response, on the same data partitions. On a random test split the best reach weighted F1-scores of 0.806 for printability and 0.773 for cell response; the repository also reports stricter splits that hold out whole studies.
- Combine both predictions into one score
The two predictions are rescaled and merged into one score from 0 to 100, the Weighted Synergistic Scaffold Quality (WSSQ), with weights the user sets. A formulation predicted not to print scores 0, however well cells might respond. The fitted models and this score are what phase B uses.
- Define a design space
For each question, a researcher opens the web app and sets the search: a cell line (or none), the biomaterials and the range each may take, cell density, printing-parameter ranges, the models to use and the WSSQ weights.
- Search with Bayesian optimisation
Optuna’s tree-structured Parzen estimator (TPE) proposes formulations inside that space, scores them in batches with the WSSQ objective, and uses each result to decide where to look next.
- Return a ranked shortlist
The best candidates come back ranked by predicted WSSQ, with the predicted class probabilities behind each score and a distance to the nearest published formulation, so a confident prediction can be told apart from an extrapolation.
- Draft a fabrication protocol
For a chosen candidate, a language model drafts a step-by-step protocol, grounded in the three nearest published formulations and told to flag, not fill in, anything missing or implausible. It is a draft for an experimentalist to check, not a validated method.
Two phases: built once, then run for every question. Redrawn from the MLATE V3 workflow figure (Rafieyan et al., 2026, CC BY 4.0); the original is on the project page.
Making it usable
A model in a notebook helps the person who wrote it. MLATE has been open from the first version: the first paper released the trained models, and the datasets and code of the second and third versions are public so that others can check, reuse and extend them. The third version also runs as a web app, so a researcher without a programming background can define a design space and get a proposed formulation, checked against the range seen in the literature, in a browser.
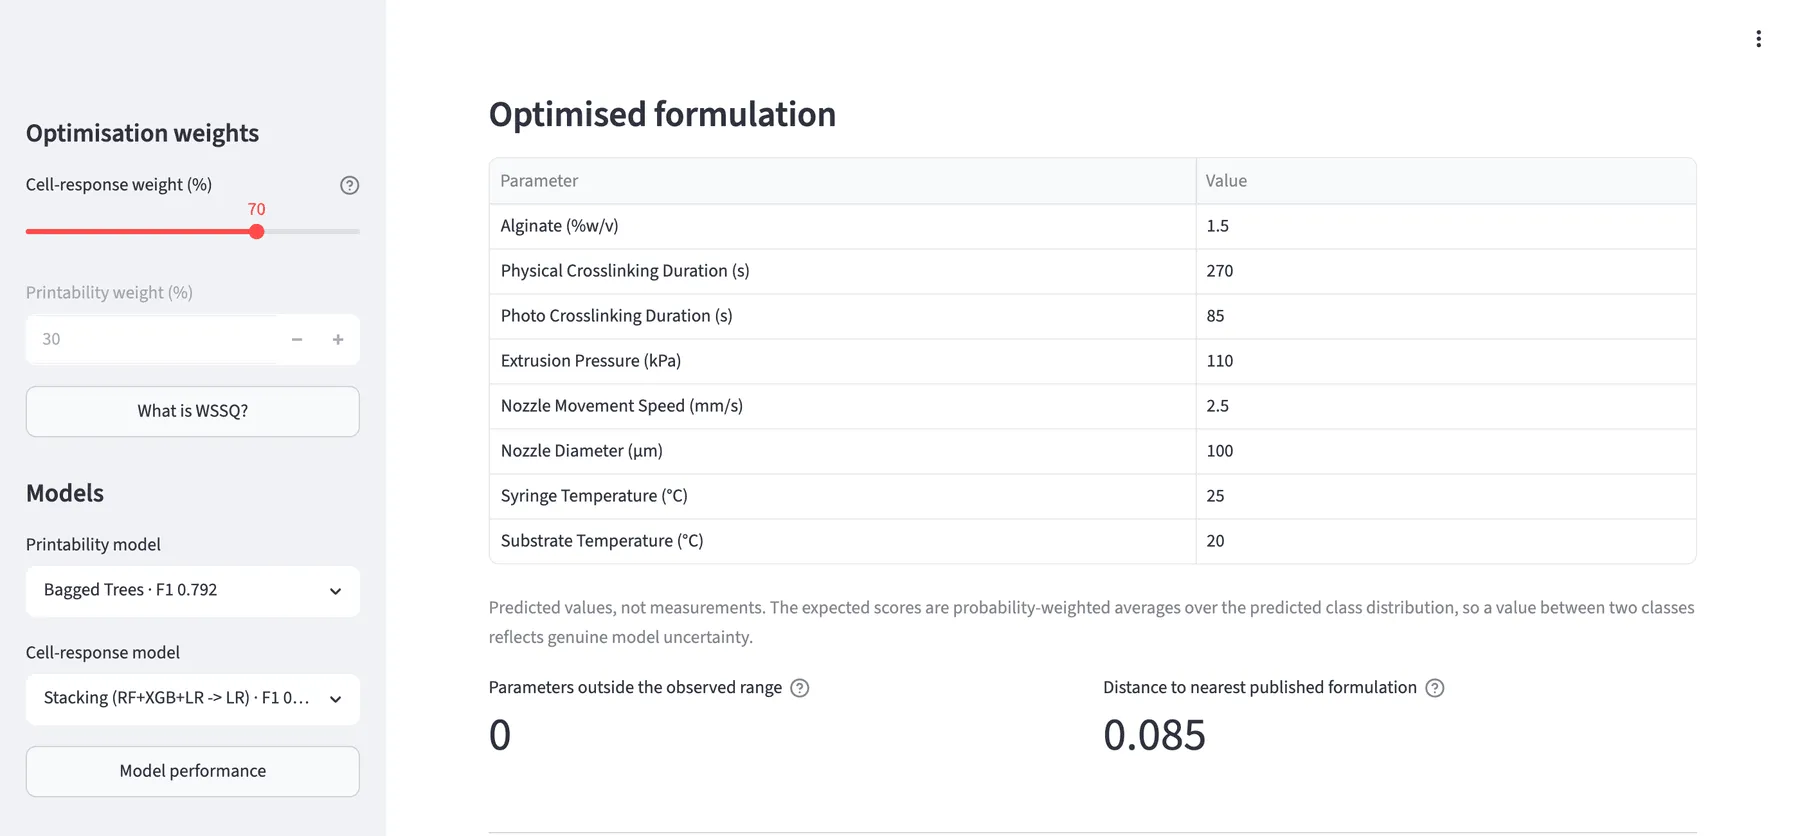
Widening the scope mattered too. The first dataset covered cardiac scaffolds; the latest covers 18 tissue-engineering contexts, so more groups can apply the tool to their own problems. Coverage is far from even, though, and a prediction is only as good as the evidence behind its context.
Fig. 10Data
18 contexts, very uneven coverage
| Context | Bar | Samples |
|---|---|---|
| Cardiac (the V1 context) | 575 | |
| Liver | 517 | |
| Vascular | 265 | |
| Undifferentiated stem cells | 261 | |
| Acellular | 234 | |
| General biocompatibility | 177 | |
| Bone | 154 | |
| Lung | 154 | |
| Cartilage | 100 | |
| Kidney | 94 | |
| Fewer than 50 samples each | ||
| Skeletal muscle | 45 | |
| Skin | 16 | |
| Neural | 15 | |
| Cervix | 13 | |
| Adrenal | 12 | |
| Parathyroid | 7 | |
| Non-mammalian | 4 | |
| Pancreas | 3 | |
Two contexts hold 41% of the samples; the eight smallest have fewer than 50 each. Predictions for the smallest contexts rest on little evidence. “Acellular” is one of the 18 contexts; separately, 1,573 samples describe prints without cells.
Source: MLATE V3 public dataset (GitHub, commit 68a302c), samples counted by tissue-engineering context. Download the data (CSV)
Show the numbers
| Context | Samples | Share of all samples |
|---|---|---|
| Cardiac | 575 | 21.7% |
| Liver | 517 | 19.5% |
| Vascular | 265 | 10.0% |
| Undifferentiated stem cells | 261 | 9.9% |
| Acellular | 234 | 8.8% |
| General biocompatibility | 177 | 6.7% |
| Bone | 154 | 5.8% |
| Lung | 154 | 5.8% |
| Cartilage | 100 | 3.8% |
| Kidney | 94 | 3.6% |
| Skeletal muscle | 45 | 1.7% |
| Skin | 16 | 0.6% |
| Neural | 15 | 0.6% |
| Cervix | 13 | 0.5% |
| Adrenal | 12 | 0.5% |
| Parathyroid | 7 | 0.3% |
| Non-mammalian | 4 | 0.2% |
| Pancreas | 3 | 0.1% |
| All contexts | 2,646 | 100% |
What MLATE is not
It is not an oracle, and it does not replace experiments. Its predictions inherit the gaps and biases of the published record. I see it as decision support: a way to narrow a large search space so that the first round of experiments is better informed. The final word always belongs to the lab.
A high score means “worth testing”, not “will work”.
What would help next
Tools like MLATE are limited less by algorithms than by data. Three changes in how scaffold studies are reported would help every effort of this kind:
- reporting a minimum set of fabrication variables, including printing temperatures and crosslinking times, in every paper;
- publishing formulations that did not work, not only the ones that did;
- sharing results as machine-readable tables rather than only as figures.
Fig. 11Data
What the papers leave out
Missing from more than half of the samples50% line
| Variable | Bar | Samples with no recorded value |
|---|---|---|
| Substrate temperature | 57.6% (1,523 of 2,646) | |
| Syringe temperature | 51.8% (1,371 of 2,646) | |
| Nozzle speed | 31.3% (829 of 2,646) | |
| Photo-crosslinking time | 30.5% (807 of 2,646) | |
| Physical crosslinking time | 28.2% (747 of 2,646) | |
| Extrusion pressure | 28.0% (740 of 2,646) | |
| Nozzle diameter | 5.1% (135 of 2,646) | |
| Cell density (cell-laden samples only) | 1.4% (15 of 1,073) |
- Substrate temperature: 57.6% (1,523 of 2,646)
- Syringe temperature: 51.8% (1,371 of 2,646)
- Nozzle speed: 31.3% (829 of 2,646)
- Photo-crosslinking time: 30.5% (807 of 2,646)
- Physical crosslinking time: 28.2% (747 of 2,646)
- Extrusion pressure: 28.0% (740 of 2,646)
- Nozzle diameter: 5.1% (135 of 2,646)
- Cell density (cell-laden samples only): 1.4% (15 of 1,073)
Printing temperatures are missing from more than half of all samples. A blank means no value was recorded; for some variables it can also mean the variable does not apply (for example, photo-crosslinking time for inks that are not photo-crosslinked).
Source: MLATE V3 public dataset (GitHub, commit 68a302c); an empty or “nan” cell counts as no recorded value. Download the data (CSV)
Show the numbers
| Variable | No value | Samples | Share |
|---|---|---|---|
| Substrate temperature | 1,523 | 2,646 | 57.6% |
| Syringe temperature | 1,371 | 2,646 | 51.8% |
| Nozzle speed | 829 | 2,646 | 31.3% |
| Photo-crosslinking time | 807 | 2,646 | 30.5% |
| Physical crosslinking time | 747 | 2,646 | 28.2% |
| Extrusion pressure | 740 | 2,646 | 28.0% |
| Nozzle diameter | 135 | 2,646 | 5.1% |
| Cell density (cell-laden samples only) | 15 | 1,073 | 1.4% |
If you work in biofabrication and want to try MLATE on your own problem, the web app and the code and datasets are open, and the project page links to all three papers. I am always glad to hear how it does on real formulations, and where it falls short.
Notes
V1 reported accuracy on cardiac scaffolds, while V3 reports weighted F1 on a larger and different task, so their headline numbers cannot be compared directly. ↩